

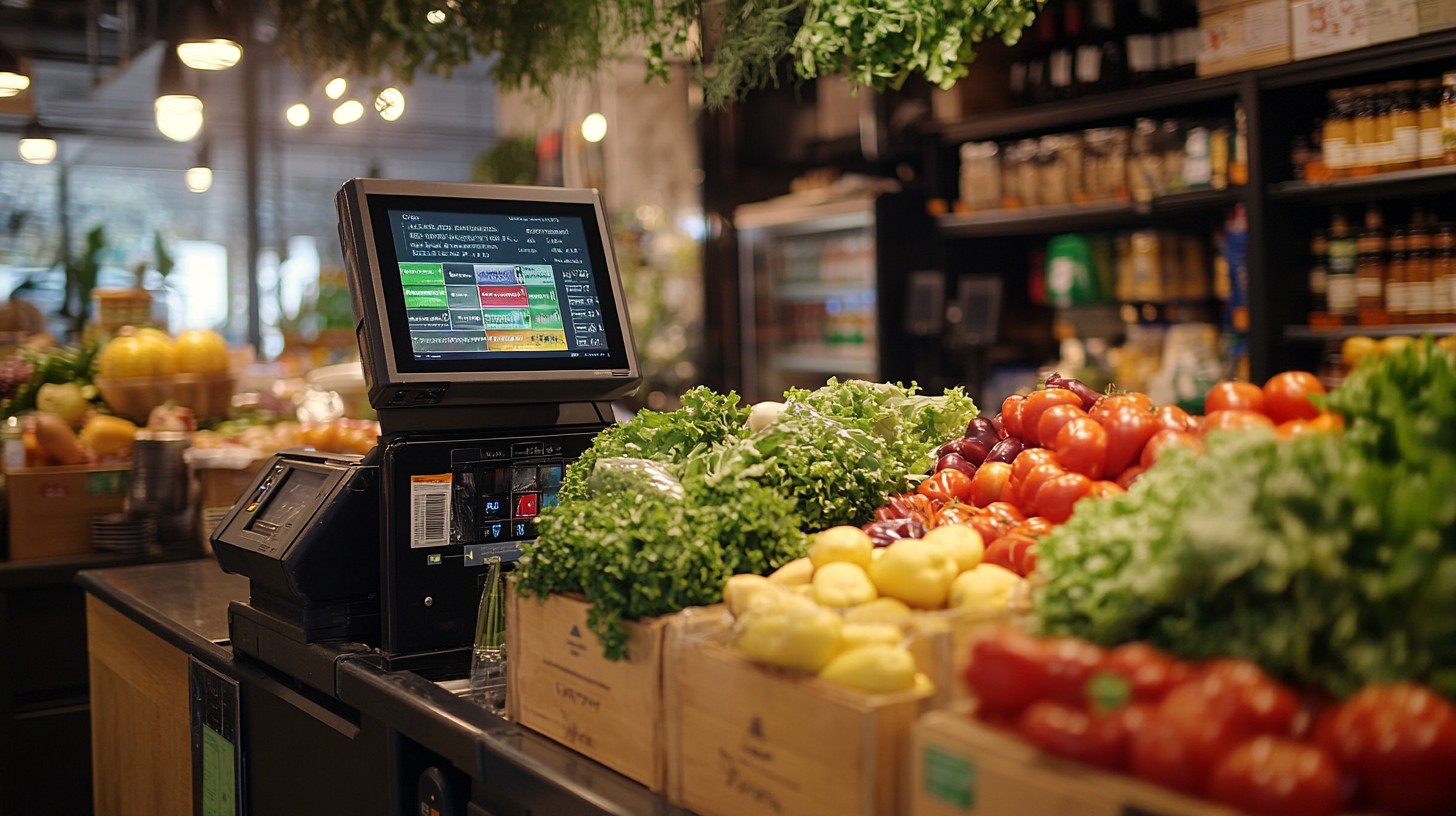

UK food and non-alcoholic beverage inflation eased to 2.2% in the 12 months to June 2026, down from 3.0% in May, according to the Office for National Statistics (ONS). This marks a significant stabilization from the historic 19.1% peak seen in March 2023. Concurrently, Kantar reported like-for-like grocery inflation softening to 3.1%. Despite this deceleration, cumulative prices remain structurally elevated, with food costs up 30.5% since April 2022, continuing to squeeze lower-income households.
Introduction
British shoppers are experiencing a notable stabilization at the supermarket checkouts as the mid-point of 2026 approaches. According to the latest data releases from the Office for National Statistics (ONS) and independent market analysts, the blistering grocery price shocks of recent years have transitioned into a period of more moderate, single-digit growth.
While a declining rate of inflation means that prices are rising more slowly rather than actually falling, the deceleration offers a breathing room for consumers. However, underlying structural shifts in supply chains, statutory domestic cost pressures, and geopolitical factors mean that grocery bills remain permanently higher than pre-crisis baselines. This report details the latest monthly statistics, shifting market shares, and consumer trends shaping the UK food landscape.
Table of Contents
- Headline Food Inflation Figures (2026)
- Category Breakdown: What is Rising and Falling?
- Supermarket Market Share and Promotion Trends
- The Reality of Easing Inflation: Cumulative Impact
- Key Drivers Behind the 2026 Trends
Headline Food Inflation Figures (2026)
The official annual inflation rate for food and non-alcoholic beverages in the United Kingdom fell to 2.2% in the 12 months to June 2026. This represents a significant deceleration from the 3.0% recorded in May 2026, and an even steeper drop from the 3.7% seen in April.
To provide historical context, this is the lowest level of food price growth tracked by the ONS since late 2024, moving far away from the post-pandemic peak of 19.1% recorded in March 2023.
In parallel, industry tracker Kantar’s like-for-like grocery inflation metric recorded a rate of 3.1% for the four-week period ending mid-May 2026. This is the slowest pace of supermarket price growth documented by the firm since December 2024, validating the broader macroeconomic slowdown.
| Metric / Source | April 2026 | May 2026 | June 2026 |
| ONS Food & Non-Alcoholic Beverage Inflation (YoY) | 3.7% | 3.0% | 2.2% |
| Kantar Like-for-Like Grocery Inflation | 3.4% | 3.1% | TBC |
| Overall UK CPIH Inflation Rate | 3.0% | 3.0% | 3.0% |
Category Breakdown: What is Rising and Falling?
The headline food inflation rate masks substantial variations across different supermarket aisles. According to the ONS, specific product groupings have driven the downward pressure on the headline rate, while others remain stubborn.
Downward Price Pressures
The primary contributors to the deceleration into the summer of 2026 include:
- Meat and Poultry: Price growth slowed notably, easing structural budget pressures for standard household meals.
- Oils and Fats: Subsided from previous global commodity spikes, showing a marginal month-on-month contraction.
- Sugar and Confectionery: Jam, chocolate, and sugar items saw a reduction of 0.03 percentage points in their inflation contributions.
Persistent Price Categories
Conversely, healthier staple food items have seen more robust annual price gains. Data compiled in recent tracking reports highlights a widening disparity:
- Protein Foods: Saw the largest annual increase among core food categories, rising by 4.0%.
- Fruit and Vegetables: Remained upwardly mobile with a 1.7% annual increase, driven partly by unpredictable domestic weather and import overheads.
Supermarket Market Share and Promotion Trends
The shifting financial landscape has altered consumer behavior and rewritten the balance of power among Britain’s top grocers. The long-term trend from 2017 to 2026 highlights a major transfer of market share from the traditional “Big Four” to German discounters. In 2017, the Big Four held roughly 73.3% of the grocery market; by mid-2026, this combined share fell to approximately 65.3%.
Lidl achieved a historic milestone in May 2026, capturing a record-high market share of 8.6% (up 0.5 percentage points year-on-year), firmly securing its position as Britain’s fifth-largest grocer.
Current Great Britain Grocery Market Share (12 Weeks to May 2026)
- Tesco: 28.2% (Up from 27.9% in 2025)
- Sainsbury’s: 15.2% (Up 0.1 percentage points)
- Asda: 11.5%
- Aldi: 10.8%
- Lidl: 8.6%
- Morrisons: 8.3%
- Waitrose: 4.5%
- Co-op: 5.1%
- Ocado: 2.1% (Fastest growing online-only specialist, up 10.2% in sales)
The Rise of Promotional Shopping
To cope with persistent price floors, UK shoppers are heavily relying on loyalty-card schemes and temporary price cuts. Kantar reported that 30.3% of all grocery sales included a promotional deal in May 2026, up from 28.4% the previous year. Spending on promoted items surged by 9.5% year-on-year, while full-price sales remained entirely flat at 0.1% growth.
The Reality of Easing Inflation: Cumulative Impact
A common point of confusion for consumers is the distinction between a drop in the rate of inflation and a drop in prices. Shelf prices are not falling back to pre-crisis levels.
According to ONS tracking data utilized by the Food Foundation, the absolute price of food in the UK has risen by 30.5% between April 2022 and June 2026.
This structural shift means the baseline cost of feeding a household has permanently escalated. The Food Foundation’s “Basic Basket” model shows that a standard weekly food shop for an adult woman now costs £53.51, while the equivalent basket for an adult man costs £60.24. This reflects a respective increase of 30.6% and 38.4% since the tracking began in 2022.
The societal impact is starkest among low-income brackets. The latest Broken Plate report findings show that households with children in the lowest income quintile would need to allocate 85% of their total disposable income to afford the dietary recommendations outlined in the government’s Eatwell Guide, compared to just 11% for households in the highest income bracket.
Key Drivers Behind the 2026 Trends
Several clear structural components explain why retail food prices remain sticky even as wholesale commodity tracking shows stabilization:
- Asymmetric Price Transmission (“Rocket and Feather” Effect): Historical analysis of UK food supply shocks over three decades demonstrates that when major import or agricultural shocks hit, retail prices shoot up rapidly. However, when wholesale input costs ease, shelf prices come down slowly and partially—declining by an average of just 1% of the original rise after six months, and only 7% after two full years.
- Domestic Operational Costs: UK retailers face elevated baseline expenses. Recent increases in the National Minimum Wage and changes to National Insurance contributions have structurally increased supermarket operating costs, limiting their capacity to lower shelf prices significantly.
- Tariff and Import Policy: A government initiative to reduce import tariffs by £150 million across specific food categories has provided minor relief, equating to roughly £5 in savings per household annually against an average non-alcoholic grocery spend of £4,087.
- Forward Risks: Industry experts warn that potential escalation or supply chain disruptions tied to geopolitical friction in the Middle East and the ongoing climate emergency threaten to reverse the downward trend by late 2026.
Key Takeaways
- June 2026 Level: UK food inflation dropped to 2.2%, a noticeable decline from 3.0% in May 2026.
- Peak vs Present: Current figures sit well below the historic peak of 19.1% experienced in March 2023.
- Cumulative Cost: Grocery prices are 30.5% higher on average than they were in April 2022.
- Lidl Milestone: Lidl has hit a record 8.6% market share, solidifying its place as the UK’s fifth-largest supermarket ahead of Morrisons.
- Promotion Surge: Over 30% of all grocery spend is driven by promotional deals as shoppers maximize loyalty discounts.
Expert Insight
Commenting on the mid-2026 data, senior food policy researchers note that the narrowing gap between top-line inflation and household wage growth is a positive macroeconomic indicator, but warns against premature celebration.
The divergence between stable wholesale farmgate values and climbing retail prices indicates that structural processing costs, corporate margin recovery, and labor overheads are dominating shelf pricing dynamics. For the lowest-income families, a 2.2% inflation rate built on top of a 30% cumulative price hike means nutritional poverty remains a critical issue across the UK.
Frequently Asked Questions
What is the current UK food inflation rate in 2026?
According to the Office for National Statistics (ONS), the annual food and non-alcoholic beverage inflation rate fell to 2.2% in the 12 months to June 2026, down from 3.0% in May.
Does falling food inflation mean supermarket prices are dropping?
No. Falling inflation means that prices are still rising, but at a slower rate than before. For prices to actually drop, the inflation rate would need to be negative (deflation).
How much have grocery prices risen since the cost-of-living crisis started?
Between April 2022 and June 2026, the cumulative cost of food items in the UK increased by 30.5% based on official ONS index data.
Which supermarket has grown the fastest in 2026?
Lidl has seen significant growth, achieving a record-high market share of 8.6% by mid-2026, surpassing Morrisons to become Britain’s fifth-largest grocery retailer. Ocado remains the fastest-growing online-only specialist with a 10.2% sales increase.
Why do healthy foods seem more expensive?
Data shows that healthy foods remain nearly twice as expensive per calorie as less nutritious options. In 2026, core protein items rose by 4.0% annually, outstripping the average headline food inflation rate.
What percentage of grocery sales are on promotion?
Approximately 30.3% of all supermarket checkout sales in the UK now involve some form of promotional deal or loyalty discount card usage, up nearly two percentage points year-on-year.
What is the average annual grocery bill for a UK household?
Excluding alcohol, the average annual shopping bill for food and drink per UK household stands at approximately £4,087 in 2026.
What factors are keeping UK food prices high?
Key drivers include increased domestic costs such as National Insurance adjustments and National Minimum Wage increases, along with the slow transmission of lower wholesale prices down to the consumer level.

